Data Collected - Graph
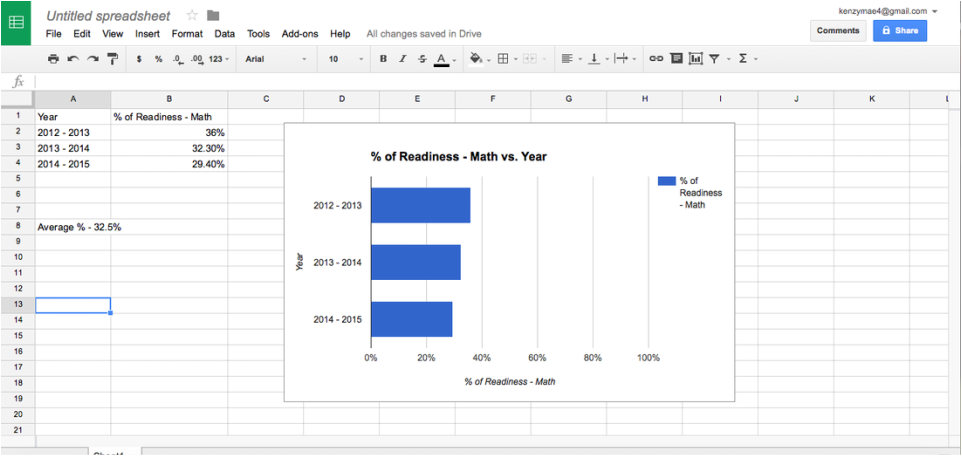
I took a look at the results of the Mathematics section on the ACT for Greenville High School. I then created a graph that represents the three years I analyzed.
I took a look at the results of the Mathematics section on the ACT for Greenville High School. I then created a graph that represents the three years I analyzed.
|
Survey Data
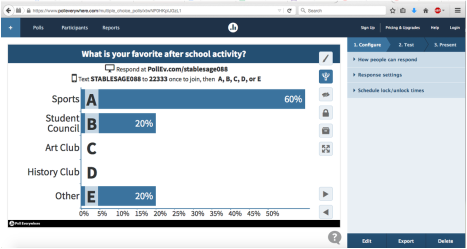
The survey I conducted was what is your favorite after school activity. I found that 3/5, or 60%, enjoy playing sports after school. If I were to use this survey in my classroom, I could use the results to further ask students what they enjoy about after school sports or any of the other answers could be analyzed in further detail. |
|
In My Classroom
I believe I will use spreadsheets, surveys, and polls frequently in my classroom. Creating spreadsheets for my classes will help students better understand data and trends. Students will also be able to create spreadsheets to help them better understand content. Giving my students surveys at the end of units or lessons will help improve my teaching strategies and lessons as a whole.
I believe I will use spreadsheets, surveys, and polls frequently in my classroom. Creating spreadsheets for my classes will help students better understand data and trends. Students will also be able to create spreadsheets to help them better understand content. Giving my students surveys at the end of units or lessons will help improve my teaching strategies and lessons as a whole.
